
Visualizing the "Unsung Heroes": Other Factors Decomposition
Beyond the Ad Spend
Your marketing ecosystem is bigger than just Facebook and Google Ads. A truly holistic view must account for the “free” work you do (like newsletters and organic social) and the economic reality you live in.
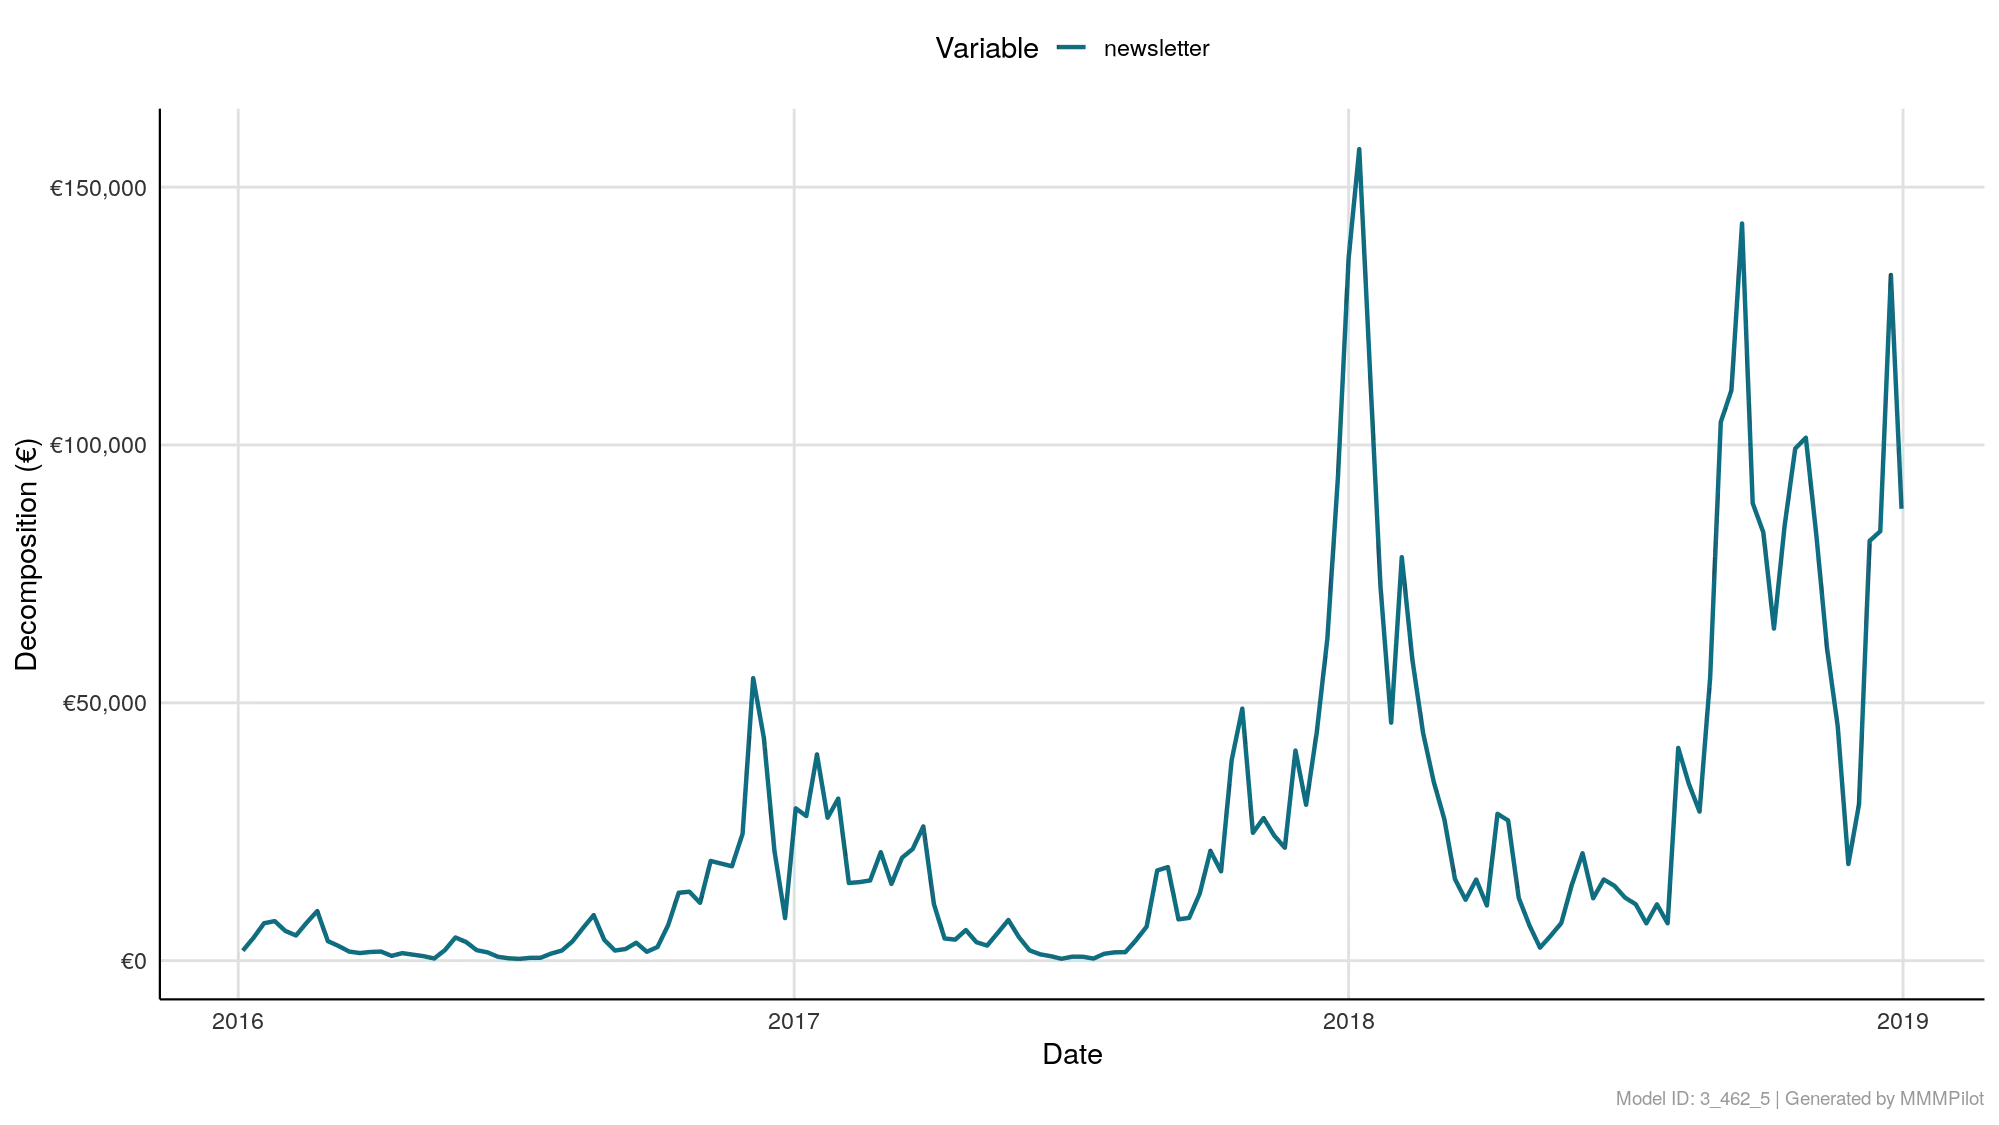
The Other Factors Decomposition over Time chart visualizes the revenue impact of everything that isn’t paid media or direct competitor activity. It proves the value of your organic efforts and measures the influence of the broader economy.
How to Read the Chart
This chart functions exactly like the “Paid Channels” decomposition, but for your non-paid variables.
- X-Axis (Time): The timeline of your analysis.
- Y-Axis (Decomposition/Contribution): The monetary value (Revenue) or volume (Conversions) generated by these specific factors.
- The Variables: You will typically see lines representing:
- Organic Media: E.g.,
newsletter_sends,organic_social_posts. - Contextual Factors: E.g.,
unemployment_rate,consumer_confidence, orweather.
- Organic Media: E.g.,
Strategic Analysis: The “Pilot’s” View
Use this chart to validate your “sweat equity” and understand the environment.
1. Validating CRM and Organic Efforts
In the example image, we see a teal line for newsletter.
- The Pattern: Notice how it isn’t a flat line? It has massive spikes.
- The Insight: This confirms that your email marketing is driving significant incremental revenue. The spikes likely correlate with specific blast dates. This chart proves to stakeholders that cutting the “free” newsletter would actually hurt the bottom line.
2. The Economic “Weather Report”
If you included economic data (like inflation or CLI) during the Fred Discovery phase, it appears here.
- Positive Line: The economy is currently boosting your sales (a tailwind).
- Negative Line: Macroeconomic factors are dragging your sales down (a headwind).
- Why it matters: If sales are down, this chart can prove it wasn’t “bad marketing,” but rather a “bad economy,” protecting your budget from unfair cuts.
3. “Organic” vs. “Baseline”
Do not confuse this chart with the Trend/Baseline chart.
- Baseline: Revenue that happens automatically with zero effort (brand equity).
- Other Factors (This Chart): Revenue that happens because of specific non-paid actions (like writing an email) or specific external events.
Summary
- Spikes in Organic? Your content team is driving real revenue.
- movements in Economics? External forces are influencing your customers’ wallets.
- Flatline? The variable (e.g., a specific organic channel) is likely not contributing to sales and might need a strategy rethink.