
Visualizing Efficiency: Response Curves & Saturation
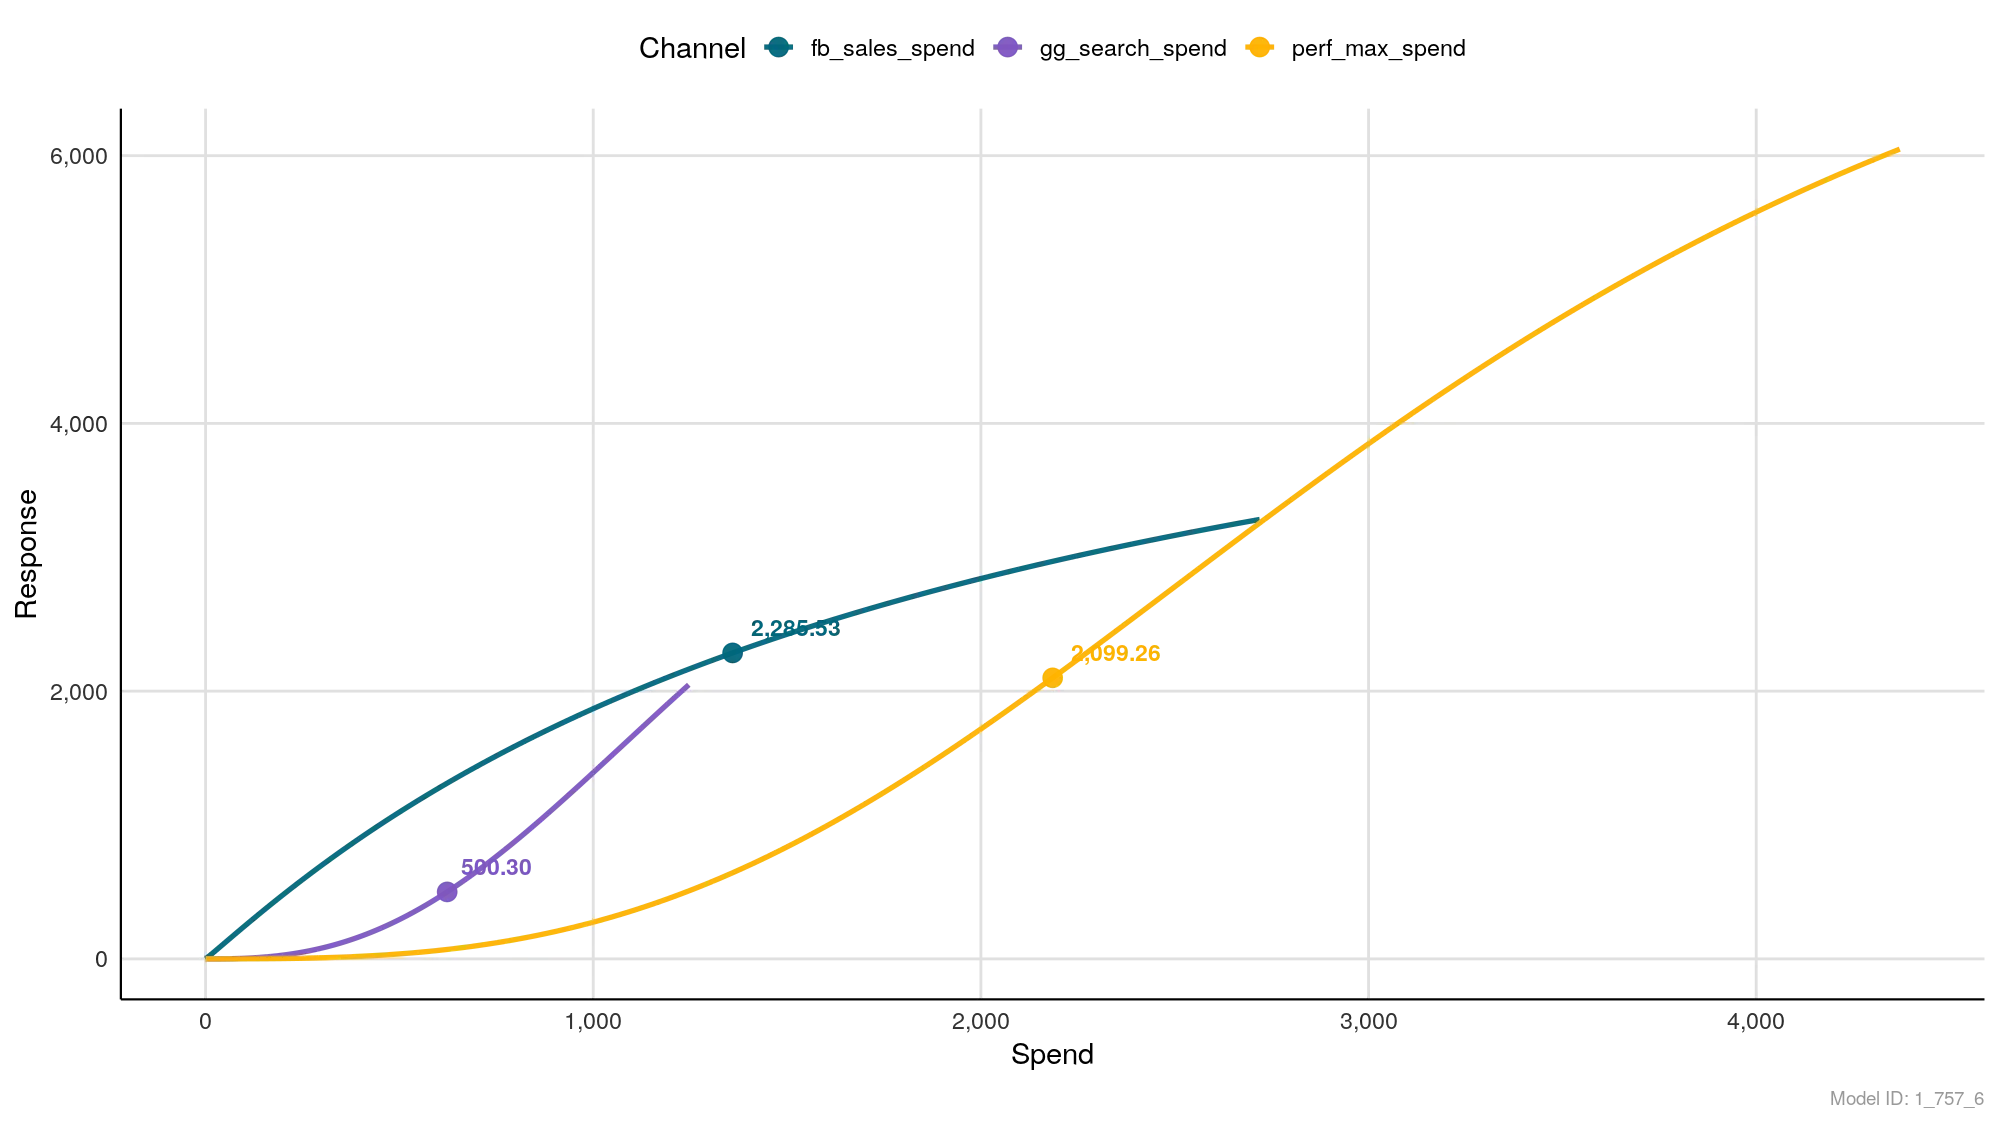
The “Law of Diminishing Returns” Visualized
One of the hardest truths in marketing is that spending double the budget does not guarantee double the sales.
The Response Curves chart is the visual proof of this economic reality. It maps the relationship between how much you spend (X-Axis) and how much revenue you generate (Y-Axis).
Think of this chart as an “efficiency scanner.” It tells you which channels are “hungry” for more budget and which channels are “full.”
How to Read the Chart
1. The Axes
- X-Axis (Spend): This is your Adstocked Spend. It accounts for the fact that money spent today might still influence a customer next week.
- Y-Axis (Response): This is the Result (Revenue or Conversions) generated by that spend.
2. The Curve Shapes
The shape of the line tells you the scalability of the channel:
- Steep Line (45° angle or higher): High Efficiency. Every extra dollar you spend yields a significant return. The channel is scalable.
- Flattening Line (Horizontal): Saturation. The curve is bending over. You are spending more money, but the line isn’t going up much higher. This is the Point of Diminishing Returns.
3. The Dot (You Are Here)
On each curve, you will see a specific marker (a dot) with a number (e.g., 2,285.53).
- What it represents: This is your Mean (Average) Spend for that channel during the analysis period.
- Why it matters: It shows your current position on the curve. Are you sitting at the bottom (underspending) or at the very top (maxed out)?
Strategic Analysis: The “Pilot’s” View
Use this chart to decide where to allocate your next dollar.
Scenario A: The “Rocket Ship” (Undersaturated)
- Visual: Look at the Yellow Line (
perf_max_spend) in the example. - Observation: The line is straight and steep. It hasn’t started to flatten out yet.
- The Strategy: Scale Up. This channel creates linear growth. If you add budget here, you will likely see a proportional increase in sales.
Scenario B: The “Ceiling” (Saturated)
- Visual: Look at the Teal Line (
fb_sales_spend) in the example. - Observation: The curve starts steep but begins to bend and flatten at the top.
- The Strategy: Maintain or Optimize. You are nearing the limit of what this audience/creative combination can deliver. Pumping more money in might simply increase your CPA (Cost Per Acquisition) without bringing in many new customers.
Summary
- Steep Slope? ✅ Green light to spend more.
- Flat Slope? ⚠️ Caution. You are paying more for less. Consider moving that budget to a steeper curve.