
Visualizing the "Echo": Weibull PDF Adstock
The “Memory” of Your Marketing
We all know that if you see a TV commercial today, you might not buy the product until next week. Marketing leaves a lingering impression in the consumer’s mind. In data science, we call this Adstock.
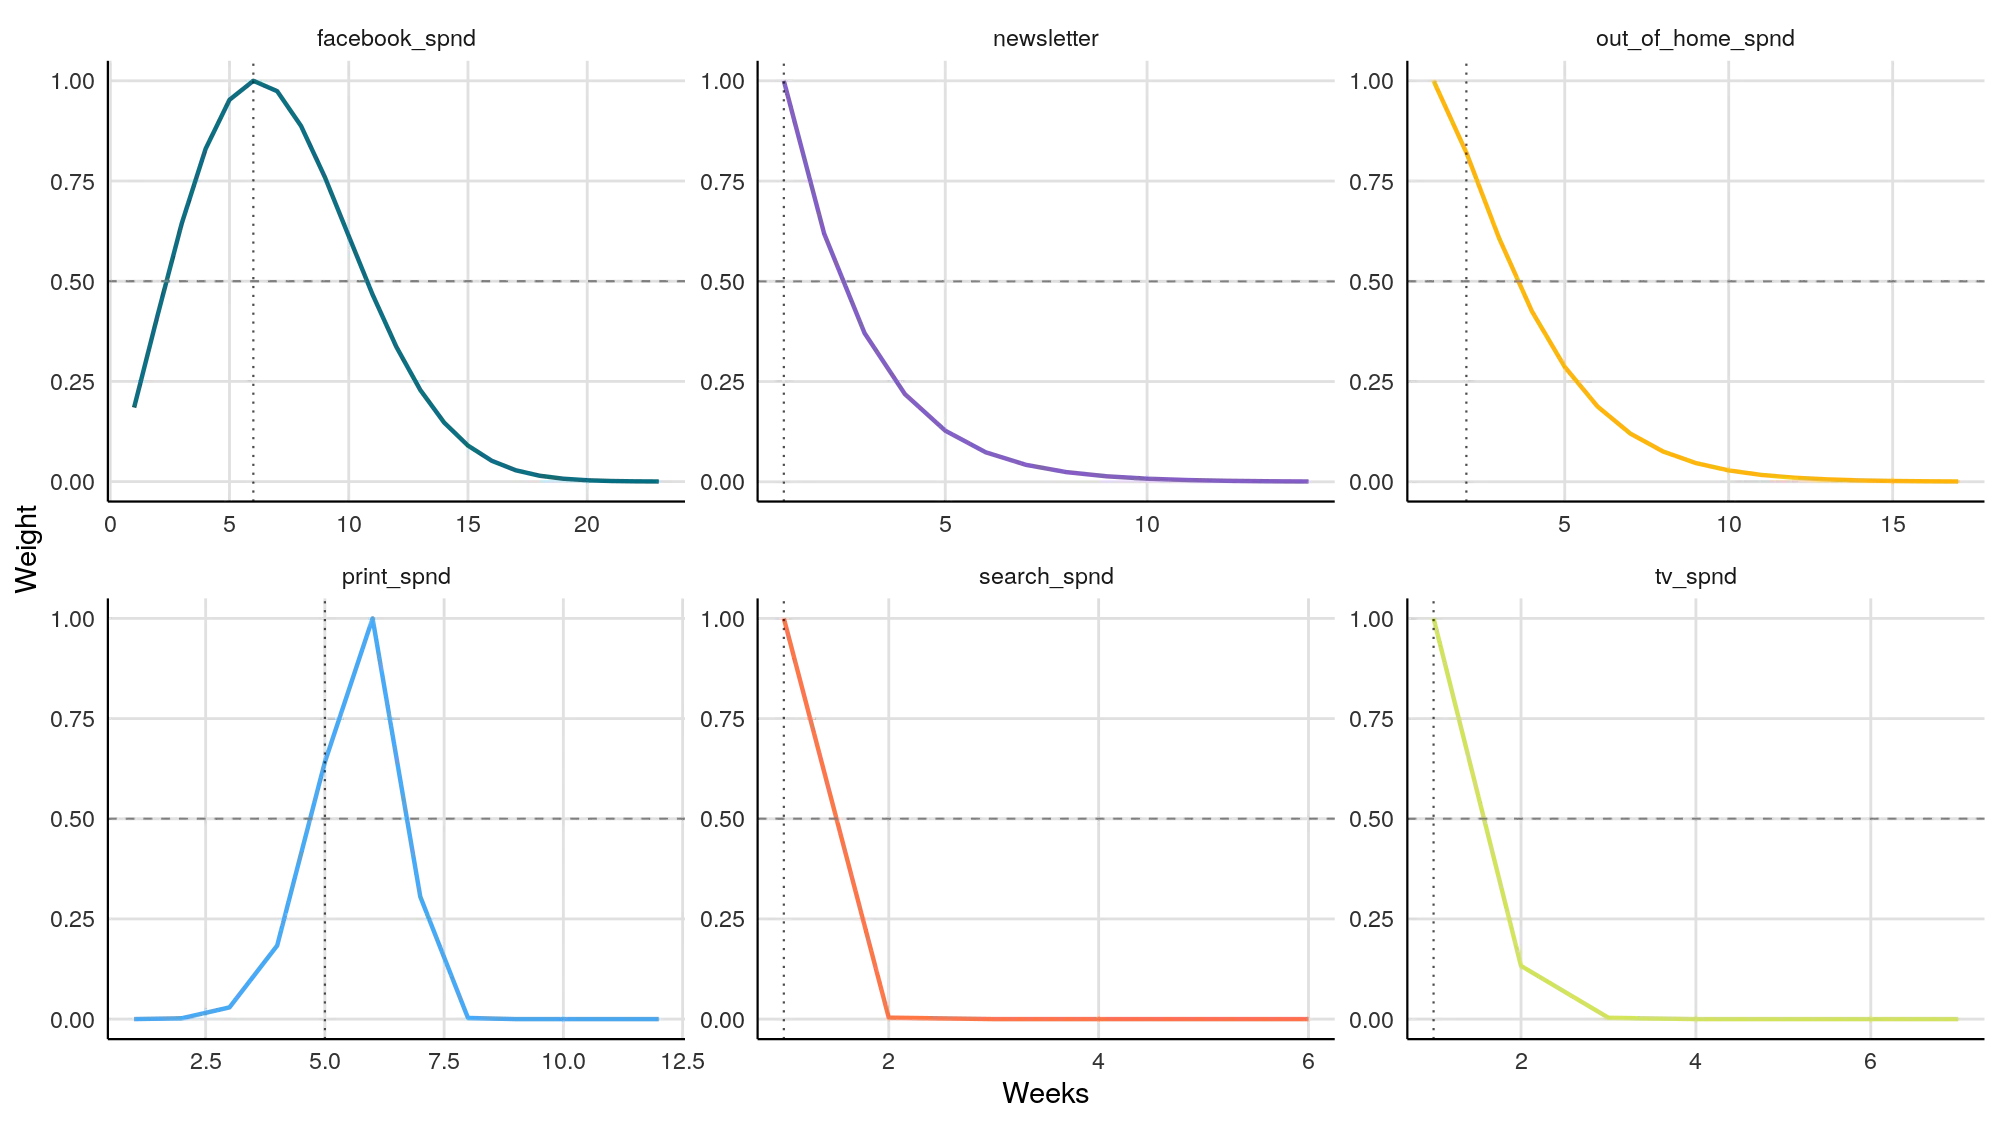
The Weibull PDF Adstock chart visualizes exactly how long your ads “live” in the real world. It maps the decay of your marketing message—from the moment you spend the money to the moment the influence fades away completely.
Why “Weibull PDF”?
Traditional models assume ads fade away instantly (like a straight line dropping). But reality is more complex.
- Weibull PDF (Probability Density Function) is a flexible curve that allows for Lagged Effects.
- It can model complex behaviors, like a magazine ad that takes 2 weeks to reach peak impact before fading, rather than peaking immediately.
How to Read the Curves
Each panel represents a different marketing channel.
- X-Axis (Weeks): Time elapsed since the ad ran.
- Y-Axis (Weight): The strength of the impact (Normalized to 1.0).
1. The “Slide” (Immediate Decay)
- Visual: The line starts at the very top (1.0) on Week 0 and drops immediately, looking like a slide.
- What it means: Direct Response.
- Example: In the image, look at
search_spndornewsletter. These channels work now. If you stop spending, sales drop instantly. The customer sees the ad and clicks immediately.
2. The “Hill” (Lagged Effect)
- Visual: The line starts low, climbs up to a peak (a “hump”) after a few weeks, and then slowly slides down.
- What it means: Brand Building.
- Example: In the image, look at
print_spndorfacebook_spnd.- Notice how
print_spndpeaks around Week 5? This means if you send a mailer today, the biggest sales impact won’t happen until more than a month from now.
- Notice how
3. The “Long Tail” (High Retention)
- Visual: The curve stretches far to the right (high numbers on the X-axis).
- What it means: High Memory. Your creative is “sticky,” or the medium naturally lingers (like a billboard that stays up for weeks).
Strategic Analysis: The “Pilot’s” View
Use this chart to plan your campaign timing (“Flighting”).
1. Don’t Judge Too Quickly If you launch a print campaign (based on the chart above) and see zero sales in Week 1, do not panic. The chart proves the impact is supposed to lag. You shouldn’t evaluate the ROI until Week 6 or 7.
2. Space Your Bursts If tv_spnd has a long tail that lasts 10 weeks, you don’t need to run ads every single week. You can run a heavy burst, let the “echo” carry the sales for a month, and then run another burst. This saves budget without losing presence.
3. Diagnose “Creative Fatigue” If a channel that used to have a long tail suddenly starts looking like a sharp “Slide,” your creative might be becoming forgettable.