
Reading the "ROAS Convergence" Chart: Is Your Model Stable?
The “Seismograph” of Your Analysis
When MMM Pilot (via Robyn) analyzes your data, it doesn’t just calculate the answer once. It runs thousands of trials, constantly tweaking the math to see what works best.
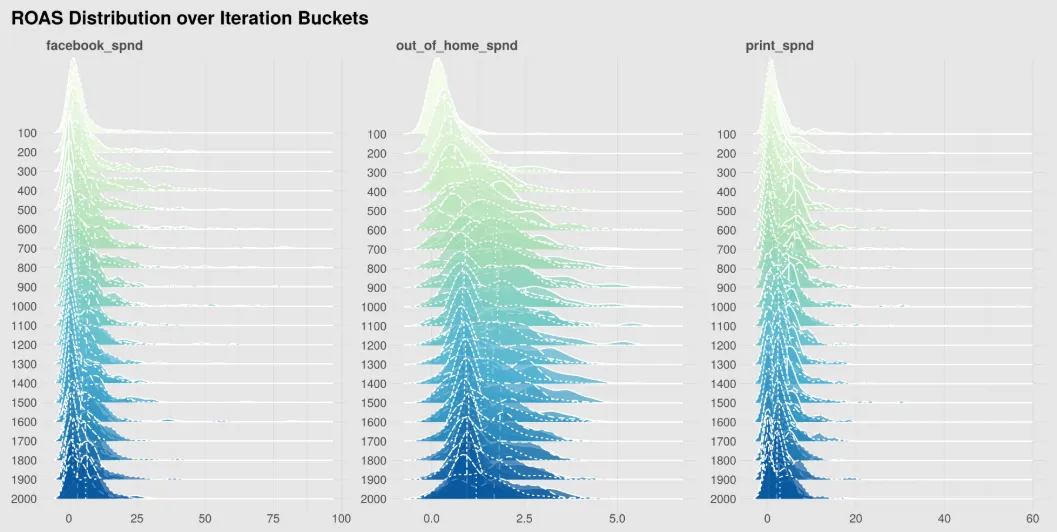
The ROAS_convergence1.png chart documents this journey. It shows you how the model’s opinion about your channels changed over time.
Think of this chart as a monitor of stability. You use it to answer one critical question: “Did the model finish thinking, or did I interrupt it while it was still guessing?”
1. The Axes: Time vs. Value
- X-Axis (Trials/Iterations): This represents the timeline of the analysis.
- Left: The beginning of the run (The model is guessing wildly).
- Right: The end of the run (The model should be confident).
- Y-Axis (Mean ROAS): This is the calculated Return on Ad Spend for your channels.
2. How to Read the Lines
Each colored line represents a specific marketing channel (e.g., Facebook, Google Ads, TV).
- The “Chaos” Phase (The Left Side): You will notice the lines jumping up and down aggressively at the beginning. This is normal. The AI is exploring extreme possibilities—testing what happens if Facebook ROAS is 0.5 and what happens if it is 10.0.
- The “Convergence” Phase (The Right Side): As you move to the right, the lines should start to flatten out. This is what data scientists call Convergence. It means the model has stopped guessing and has “settled” on a specific number.
3. Good vs. Bad Signals
✅ The Good Signal: Flat Lines
If the lines on the far right side of the chart are horizontal (flat), it means the model has reached a stable conclusion.
- Verdict: You can trust the results. Even if you ran the model for another hour, the answer likely wouldn’t change.
⚠️ The Warning Signal: “Fuzzy” or Zig-Zag Lines
If the lines at the far right are still jumping up and down significantly, the model has not converged.
- What it means: The model was still confused when the timer ran out. It found multiple different answers that all looked “kind of okay,” but it couldn’t pick a winner.
- The Risk: The ROI numbers in your final report might be unstable. If you ran the exact same project again, you might get different results.
4. Why is there a “1” in the filename?
If you have many marketing channels, Robyn splits them into multiple images (ROAS_convergence1.png, ROAS_convergence2.png, etc.) to keep the chart readable. If you have fewer than roughly 6 channels, you will only see this one file.
Summary
Check the right-hand side of this chart.
- Stable/Flat? The model is solid.
- Jittery/Moving? The model might need more data or a longer runtime to find the truth.