
Visualizing the Pulse: Paid Channels Decomposition
The “Heartbeat” of Your Marketing
While the Waterfall chart tells you how much each channel contributed in total, the Decomposition over Time chart tells you when they contributed.
This is the “heartbeat” monitor of your marketing mix. It strips away the baseline sales and external factors to reveal the isolated, raw sales power of each paid channel week by week.
What You Are Seeing
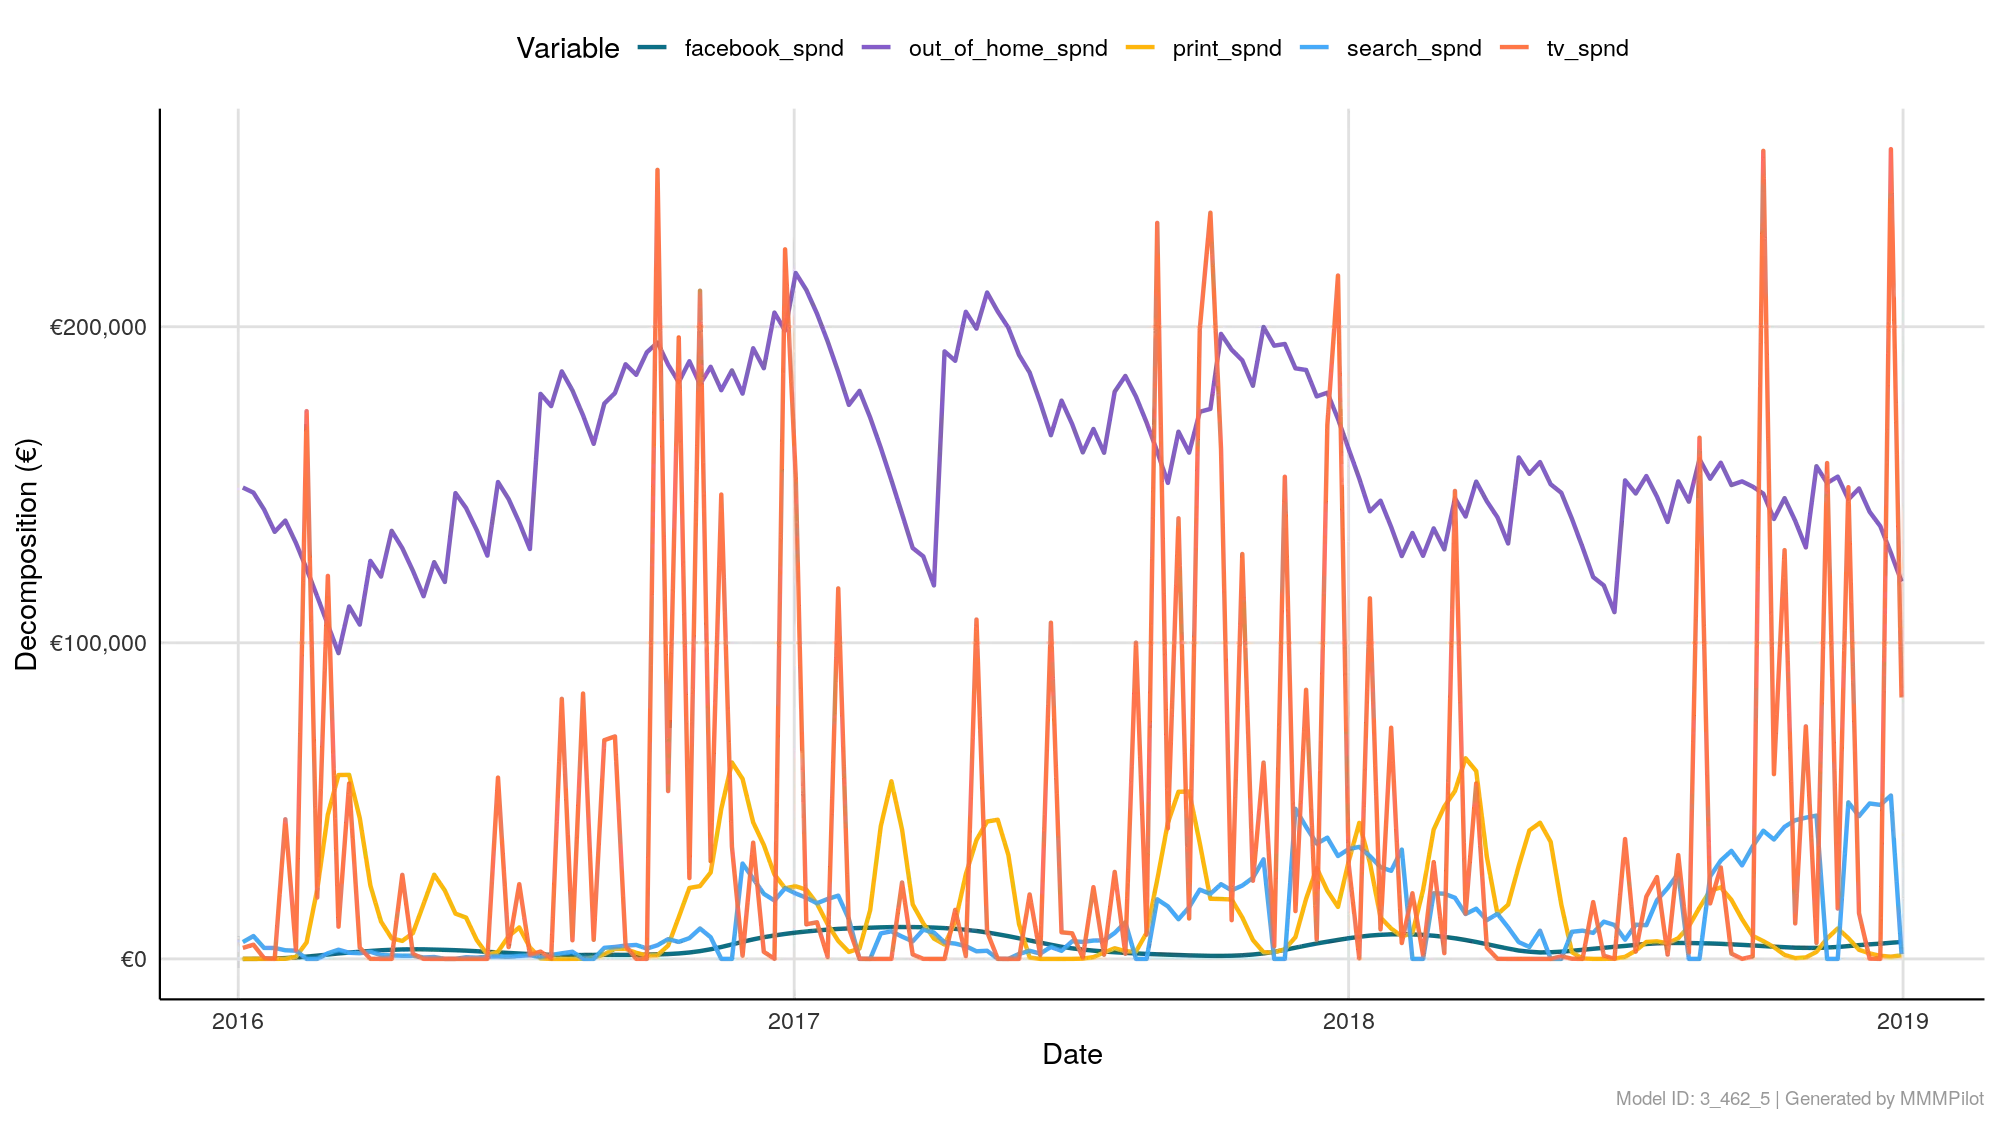
The chart plots the incremental sales driven by each channel over the timeline of your analysis.
- X-Axis (Time): The dates of your analysis (e.g., 2016–2019).
- Y-Axis (Decomposition): The monetary value (or conversion count) generated.
- Important: This is NOT a graph of how much you spent. It is a graph of the revenue you earned from that spend.
- The Lines: Each color represents a specific channel (e.g., Purple for
out_of_home, Orange fortv_spnd).
How to Read the Patterns
1. The Spikes (Campaign Bursts)
Sharp, vertical spikes usually indicate a “flighted” strategy or a specific campaign launch.
- Example: In the image, the Orange line (TV) shows massive, isolated spikes. This suggests TV was run in heavy bursts (e.g., Holiday campaigns) rather than “always-on.”
2. The Waves (Seasonality & Adstock)
You might see lines that rise and fall gently rather than spiking sharply. This is often due to Adstock (Carryover).
- The Insight: Even if you stop spending money on Monday, the sales might continue into Tuesday and Wednesday. This chart visualizes that lingering effect.
3. The Flatlines (Inactivity)
If a line hugs the bottom (zero) for a long period, it means that channel was either turned off or was completely ineffective during that window.
The “Analyst’s Check”: Spend vs. Effect
The most common mistake users make with this chart is assuming it shows budget. It does not.
Use this chart to check for Responsiveness:
- Scenario: You know you spent a consistent budget on Facebook (Blue) all year.
- The Chart: However, the Blue line on this chart is trending down significantly in Q4.
- The Conclusion: Your spend was stable, but your effectiveness (Performance) degraded. This is a clear signal of ad fatigue or market saturation.
Summary
- Tall Peaks? High-impact, short-term drivers (often Promos or TV).
- Consistent Level? “Always-on” drivers (often Search or Social).
- Trending Down? The channel is losing efficiency; time to refresh the creative or the audience.